

Micro- and nano-plastics in the coronary circulation and air pollution exposure in ischaemic heart disease presentation
Pasquale Paolisso , Lucia Scisciola , Marta Belmonte ,et al
European Heart Journal, Volume 47, Issue 39, 14 October 2026, Pages 5860–5876,
Abstract
Background and Aims
Micro- and nanoplastics (MNPs) are emerging risk factors for cardiovascular diseases. The present study aimed to evaluate the burden of MNPs in coronary blood across the spectrum of coronary artery disease (CAD), and their association with air pollution exposure and inflammation.
Methods
Cross-sectional study, including 61 consecutive patients undergoing coronary angiography for suspected CAD, stratified into: ST-segment elevation myocardial infarction (STEMI, n = 19), chronic coronary syndromes (CCS, n = 20), and controls with normal coronary arteries (n = 22). MNPs were quantified in coronary and peripheral blood using pyrolysis-gas chromatography-mass spectrometry and laser direct infrared spectroscopy. Air pollution exposure data were collected on the day of the invasive procedure (acute exposure) and over the preceding 2 years (chronic exposure).
Results
MNPs were detected significantly more frequently in STEMI patients (84.2%) than in CCS (40%) and controls (31.8%) (P = .002), with higher concentration and greater polymer diversity [median of 3 polymers (interquartile range: 2–4), P < .001]. Polyethylene was the predominant polymer (97%). The same polymers were consistently identified in peripheral and coronary blood samples from individual patients, with the highest concentrations in coronary blood (P < .001). STEMI patients showed higher levels of interleukin-6 and tumour necrosis factor-α (P≤.006) and were exposed to higher levels of PM2.5 (P≤.012). MNP detection was more frequent among smokers and patients exposed to PM2.5 > 15 µg/m3 (P = .006), with all patients presenting both factors showing detectable MNPs (P < .001). In multivariable analysis, smoking history emerged as the only independent predictor of MNP presence (odds ratio 5.69, 95% confidence interval 1.33–26.63, P = .023).
Conclusions
STEMI patients exhibited a greater burden of MNPs in coronary blood than CCS and controls. MNP detection frequently co-occurred with elevated inflammatory biomarkers, greater PM2.5 exposure, and smoking, suggesting a potential association between environmental exposure and CAD.
Introduction
Cardiovascular diseases are increasingly related to lifelong environmental exposures. The exposome concept, which integrates the totality of environmental, socioeconomic, and lifestyle factors, provides critical insight into how environmental exposures may interact with biological pathways (e.g. inflammation, oxidative stress, and hormonal disruption) to drive the onset and progression of cardiovascular disease.1 This concept holds high promise for guiding new approaches in cardiovascular disease prevention and management.2,3
Micro- and nanoplastics (MNPs) are ubiquitous environmental pollutants. Evidence is increasing that they accumulate in human tissues following exposure and are emerging as a risk factor for health.4,5 Experimental in vitro and animal studies have shown that MNPs, once in the bloodstream, can trigger systemic inflammation, vascular injury, and lipid metabolism disruption, potentially accelerating atherosclerosis progression.6,7 Beyond the effects of MNPs themselves, the potential impact of chemicals associated with plastics should also be acknowledged, including additives that may leach out (e.g. phthalates, bisphenols, and flame retardants) and environmental contaminants (e.g. heavy metals, polycyclic aromatic hydrocarbons, and persistent organic pollutants) that can adsorb onto the surface of MNPs.6,8,9
These findings have raised concerns about the potential role of MNPs in the pathophysiology of cardiovascular diseases.10–12 We previously demonstrated a significant association between the presence of MNPs in carotid artery plaques and a markedly increased risk of adverse cardiovascular events over a 34-month follow-up period.13 Nonetheless, current knowledge about the burden of MNPs in the coronary circulation across the spectrum of coronary artery disease (CAD), from the acute to the chronic setting, remains limited. Moreover, the association between MNPs, air pollution exposure, and biological pathways underlying inflammation and clinical presentation of CAD has still to be investigated.
The present study aimed to evaluate the burden (presence, concentration and type) of MNPs in the coronary blood of patients undergoing invasive coronary angiography for suspected CAD, stratified according to the clinical presentation into: (ⅰ) patients presenting with ST-segment elevation myocardial infarction (STEMI); (ⅱ) patients with chronic coronary syndromes (CCS); (ⅲ) patients with angiographically normal coronary arteries (control group). In addition, we explored associations among coronary burden of MNPs, air pollution exposure and inflammatory biomarkers across the three study groups.
Methods
Study population
This investigator-initiated, cross-sectional, multicentre study included consecutive patients undergoing invasive coronary angiography for suspected CAD between February and April 2025 at Sant’Andrea Hospital, Sapienza University of Rome (Rome, Italy), and Azienda Ospedaliera Universitaria Integrata of Verona (Verona, Italy). Inclusion criteria were: (i) age >18 years; (ii) clinical indication for invasive coronary angiography for suspected CAD, both with acute and chronic presentation; (iii) signed informed consent. Additional inclusion criteria were tailored to the patient’s clinical presentation. In detail, for the acute presentation, they included: (i) STEMI according to current guidelines14; (ii) angiographic evidence of acute thrombotic coronary occlusion/sub-occlusion (TIMI 0/1); (iii) clinical indication to primary percutaneous coronary intervention (PCI) and thromboaspiration. For the chronic presentation, they included: (i) angiographic evidence of at least intermediate coronary stenosis with indication to elective PCI or angiographically normal coronary arteries. Therefore, the overall study population consisted of three study groups: (ⅰ) patients with STEMI, undergoing primary PCI; (ⅱ) patients with CCS undergoing elective PCI; (ⅲ) patients with angiographically normal coronary arteries (control group). The protocol was approved by the institutional review board (EC Territoriale Lazio Area 1—no. 0379/2025). The present study was conducted according to the Declaration of Helsinki; all patients were informed about their participation in the study and provided informed consent for the anonymous publication of scientific data.
Study procedures
Invasive coronary angiography, primary, and elective PCI were performed according to the standard of care. To assess MNP burden (presence, concentration, and type) and inflammatory biomarkers, arterial blood samples (both peripheral and coronary) were collected during the invasive procedures, as follows (Figure 1).
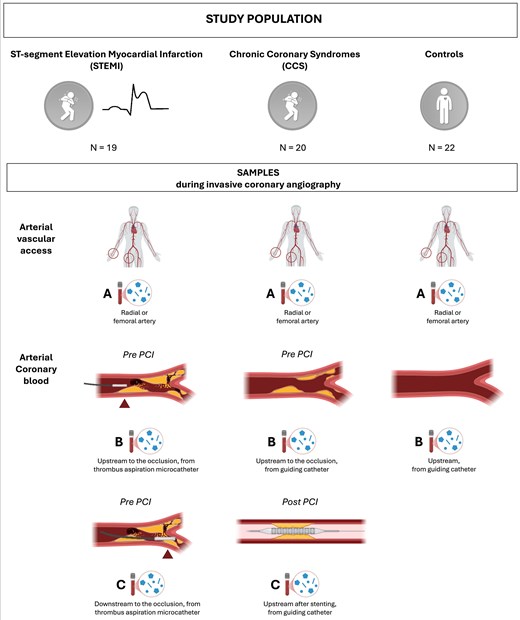
Figure 1 Study population and sampling strategy during invasive coronary angiography. CCS, chronic coronary syndrome; PCI, percutaneous coronary intervention; STEMI, ST-segment elevation myocardial infarction
In STEMI patients undergoing primary PCI, three blood samples were collected: (i) Tube A: peripheral arterial blood (collected at the arterial vascular access, from the arterial sheath); (ii) Tube B: coronary blood from the culprit vessel upstream from the coronary occlusion (before lesion crossing, from the thrombus aspiration microcatheter); (iii) Tube C: coronary blood from the culprit vessel downstream from the coronary occlusion (after lesion crossing, from the thrombus aspiration microcatheter) (Figure 1). In CCS patients undergoing elective PCI, three blood samples were collected: (i) Tube A: peripheral arterial blood (collected at the arterial vascular access, from the arterial sheath); (ii) Tube B: coronary blood before performing PCI (from the guiding catheter); (iii) Tube C: coronary blood after performing PCI (from the guiding catheter) (Figure 1). In patients with angiographically normal coronary arteries (control group), two blood samples were collected: (i) Tube A: peripheral blood (collected at arterial vascular access, from the arterial sheath); (ii) Tube B: coronary blood (from the guiding catheter) (Figure 1). Peripheral and coronary blood samples collected during the invasive procedures were stored at −20°C and sent to the core laboratory for MNP and inflammatory biomarkers analyses, according to standardized protocols to preserve the integrity of the samples.
Micro- and nanoplastics identification and quantification
The core laboratory for MNP analyses was the Research Centre on Environmental Pollution and Cardiovascular Diseases of the University of Campania ‘Luigi Vanvitelli’, Naples, Italy. The identification, quantification, and typing of plastic particles were performed in each tube for each patient (total of 161 samples: 3 tubes for 19 STEMI patients, 3 tubes for 20 CCS patients, and 2 tubes for 22 controls), using pyrolysis-gas chromatography-mass spectrometry (Py-GC/MS) and laser direct infrared (LDIR) spectroscopy.15,16 Py-GC/MS, a mass-based technique, was utilized to identify and quantify MNPs in complex biological matrices, irrespective of particle size (see Supplementary data online, Tables S1 and S2).13 Before analysis, samples underwent rigorous pretreatment involving sequential enzymatic and chemical digestion, followed by filtration to remove organic and inorganic interferences (see Supplementary data online, Figure S1). Py-GC/MS analysis was complemented and cross-validated with innovative measurements based on LDIR spectroscopy. LDIR is an advanced infrared spectroscopy technique employing a quantum cascade laser that enables the characterization of MNPs in terms of shape, size distribution, and polymer composition. The sample pre-treatment protocol involved chemical digestion, followed by filtration using specialized gold-coated filters. LDIR analysis was conducted using an Agilent 8700 LDIR system operating in particle-analysis mode (see Supplementary data online, Figure S2). Further details on the Py-GC/MS and LDIR analyses are available in the Supplementary Material—Extended Methods.
These analyses tested blood samples for the presence of multiple MNPs, including polyethylene (PE), polypropylene (PP), polystyrene (PS), acrylonitrile butadiene styrene copolymer (ABS), styrene-butadiene copolymer (SBR), polymethylmethacrylate (PMMA), polycarbonate (PC), polyvinylchloride (PVC), polyethylene terephthalate (PET), nylon 6, and nylon 66. The selection of MNP types was based on their high environmental and human relevance—representing the polymers most commonly detected in prior studies of cardiovascular and biological samples—and the availability of validated methodologies for their detection and quantification using Py-GC/MS analytical workflow.10 This targeted panel, therefore, encompasses the main polymers to which humans are routinely exposed in daily life through environmental and dietary sources (see Supplementary Material—Extended Methods).
Contamination control and quality assurance
To address the methodological concerns raised in our previous publication, we implemented rigorous measures for contamination control and quality assurance.13,17 To assess the potential background contamination of samples, release tests (‘blank samples’) were performed on all materials used during coronary angiography and PCI procedures, including vascular sheaths, catheters, connectors, thrombus aspiration kits with filters, and empty tubes (see Supplementary data online, Figure S3). In the central laboratory, a comprehensive quality assurance and quality control (QA/QC) protocol was established to minimize contamination risk and ensure analytical accuracy. All blood samples were processed using glass tubes (Merck KGaA, Darmstadt, Germany) to prevent contamination from plasticware. All procedures were performed under a fume hood to reduce airborne particle exposure, and work surfaces were cleaned with 70% ethanol before and after each session. Laboratory personnel wore 100% cotton coats, and plastic materials were avoided throughout sample collection, pre-treatment, and analysis. Sample analyses were conducted in batches, each including one surgical consumable (SC) blank, two instrumental (IS) blanks, two procedural (PC) blanks, two quality control (QC) samples, and 15 blood samples. A schematic representation of the quality control workflow is provided in Supplementary data online, Figure S3. The concentration of each polymer was corrected by subtracting the corresponding mean blank value specific to each analyte. Method recovery was evaluated by a three-level spiking experiment in whole blood samples (low, medium, and high concentration), which showed acceptable recoveries for the target polymers (see Supplementary data online, Table S3). Further details on contamination control and quality assurance are available in the Supplementary Material—Extended Methods.
Inflammatory biomarkers
The assays for plasma interleukin-6 (IL-6) (Cat. #E-EL-H6156) and tumour necrosis factor-alpha (TNF-α) (Cat. #E-EL-H0109) were performed using ELISA kits from Elabscience, following the manufacturer’s instructions. Optical density was measured at 450 nm using an Infinite M Nano+ plate reader (Tecan).
Air pollution exposure
Information on the mean daily exposure of patients to air pollution compounds on the day of the invasive procedure (acute exposure) and on the mean chronic exposure over the preceding 2 years (chronic exposure) was collected. In line with prior reports,18 the following pollutants were considered: particulate matter (PM) 2.5, PM10, ozone (O3), nitric dioxide (NO2), benzene (C6H6), sulfur dioxide (SO2), and carbon monoxide (CO).
The daily and yearly average of pollutant levels were obtained by matching each patient’s address and official reports published in the ‘Agenzia Regionale Protezione Ambientale (ARPA)’ Lazio and Veneto websites, as previously described.19,20 Residential addresses were obtained from medical records and confirmed by patient interviews at hospital admission. The ARPA reports included tables listing the concentrations of various environmental pollutants, measured in micrograms per cubic metre (μg/m3), as recorded by monitoring stations distributed across Lazio and Veneto regions (Italy). Data were obtained from the air quality monitoring station closest to each patient’s residential address that was active for the previous 2 years (see Supplementary data online, Figure S4).
Both acute and chronic PM2.5 exposure levels were compared with the recommended thresholds outlined in the latest World Health Organization (WHO) Air Quality Guidelines.21 For chronic exposure, both the optimal health protection threshold (PM2.5 ≤ 5 μg/m3) and the Interim Target 3 (PM2.5 ≤ 15 μg/m3)—recommended as a realistic goal for highly industrialized countries to reduce cardiovascular and respiratory risk—were considered.
Smoking status was classified as current or former smoking vs never smoking. Cumulative tobacco exposure was quantified in smokers using pack-years.
Study objectives
The primary objective was to compare the burden (presence and concentration) of MNPs in the coronary blood of patients undergoing invasive coronary angiography for suspected CAD, stratified into: (ⅰ) patients with STEMI undergoing primary PCI; (ⅱ) patients with CCS undergoing elective PCI; (ⅲ) patients with angiographically normal coronary arteries (control group). Secondary objectives were: (i) to evaluate the association of MNPs with inflammatory biomarkers across the three study cohorts; (ii) to explore the potential association of MNPs with environmental air pollution exposure across the three study cohorts.
Statistical analysis
The normal distribution of continuous variables was assessed by histograms and q-plot; the Shapiro-Wilk test was used when required. Continuous variables with normal distribution were expressed as the mean ± standard deviation, and non-normally distributed variables as median and interquartile range (IQR). Normal ranges were presented as the 5th and 95th percentiles. Categorical variables were expressed as counts and percentages. Differences between groups were analyzed using the t-test, the Mann–Whitney U test, and Kruskal–Wallis for continuous variables and the chi-square test or Fisher’s exact test for categorical variables, as appropriate. To compare paired data, a Wilcoxon signed test, a paired sample t-test, or the Friedman test was performed as appropriate. When overall differences across the three study groups were identified using standard tests, post hoc pairwise comparisons were conducted, and the corresponding P-values were adjusted using the Bonferroni method, where appropriate. Univariate analysis was performed to identify clinically relevant predictors of MNP presence in the overall study population. Variables showing statistical significance with a P-value <.05 in univariate analysis were then entered into a multivariable logistic regression analysis to identify independent predictors of MNP detection. The odds ratio (OR) and the associated 95% confidence interval (CI) for each variable were determined. Additional regression models were conducted to test the influence of sampling methodology, inflammatory biomarkers (from both form peripheral and coronary blood), and air pollution exposure. The sample size calculation is provided in Supplementary Material—Extended Methods.
All statistical tests were two-sided, and a P-value<.05 was considered statistically significant. All analyses were performed using R statistical software version 3.5.2 (R Foundation for Statistical Computing, Vienna, Austria), Statistical Package for Social Sciences, version 28.0 (SPSS, PC version, Chicago, IL, USA), and GraphPad Prism (GraphPad Software, Inc., San Diego, CA, USA).
Results
Study population
The study population consisted of 61 patients: (ⅰ) 19 patients in the STEMI group; (ⅱ) 20 patients in the CCS group; (ⅲ) 22 patients in the control group. Overall, the mean age was 64 ± 12 years, and 17 (27.9%) were female. Baseline characteristics, cardiovascular risk factors, comorbidities, clinical presentation, and laboratory tests are shown in Table 1. Control patients were more often female compared with those with STEMI and CCS (P = .015). Comorbidities were significantly more common among CCS patients than in the other two study groups. Although the proportion of smokers did not differ significantly between groups, the cumulative tobacco exposure, as measured in pack-years, was significantly higher in patients with STEMI and CCS compared with controls (P = .003) (Table 1). Medical therapy at hospital admission was similar among the groups, except for a higher rate of antiplatelet therapy in CCS patients (P≤.012 for all) (see Supplementary data online, Table S4). Angina was more frequently observed in STEMI patients (P < .001), while dyspnoea was more common in the control group (P = .003). Haemoglobin levels and renal function were not different among the three study cohorts (Table 1). Angiographic and procedural characteristics are detailed in Supplementary data online, Table S5. Radial access was significantly more common in CCS and control patients than in those with STEMI (P = .031). STEMI patients had a notably longer total stent length compared with CCS patients (P = .039), with no significant differences in terms of single- or multi-vessel disease between the two cohorts. Baseline echocardiographic parameters were similar across the three study cohorts, except for a significantly higher left ventricular ejection fraction observed in CCS patients (P = .014, Supplementary data online, Table S6).
Table 1 Open in new tab
Baseline characteristics of the overall study population stratified according to the clinical presentation
| STEMI n = 19 | CCS n = 20 | Controls n = 22 | P-valuea | |
|---|---|---|---|---|
| Age, years | 65 ± 11 | 67 ± 12 | 62 ± 12 | .512 |
| Female sex, n (%) | 3 (15.8) | 3 (15) | 11 (50)b | .015 |
| BMI, kg/m2 | 26.2 ± 4.3 | 29.1 ± 5.7 | 26 ± 5 | .067 |
| BSA, m2 | 1.90 ± .16 | 1.97 ± .18 | 1.84 ± .18 | .065 |
| Smoking habit, n (%) | 14 (73.7) | 14 (70) | 11 (50) | .228 |
| Pack/yearse | 32 ± 9 | 26 ± 9 | 17 ± 10 | .003 |
| Hypertension, n (%) | 12 (63.2) | 15 (75) | 10 (45.5) | .142 |
| Dyslipidemia, n (%) | 12 (63.2) | 17 (85)c | 10 (45.5) | .029 |
| Diabetes mellitus, n (%) | 3 (15.8) | 6 (30) | 4 (18.2) | .503 |
| CAD, n (%) | 1 (5.3) | 7 (35) | – | .022 |
| Prior MI, n (%) | 1 (5.3) | 2 (10) | – | .579 |
| Prior PCI, n (%) | 1 (5.3) | 4 (20) | – | .169 |
| COPD, n (%) | 0 (0) | 1 (5) | 1 (4.5) | .624 |
| PAD, n (%) | 0 (0) | 5 (25) | 1 (4.5) | .019 |
| Prior CVA, n (%) | 0 (0) | 3 (15) | 0 (0) | .039 |
| AF, n (%) | 0 (0) | 4 (20) | 4 (18.2) | .123 |
| CKD, n (%) | 1 (5.3) | 4 (20) | 2 (9.1) | .321 |
| Clinical presentation | ||||
| Angina, n (%) | 18 (94.7)b,c | 9 (45) | 6 (27.3) | <.001 |
| Atypical chest pain, n (%) | 1 (5.3) | 0 (0) | 4 (13.6) | .207 |
| Dyspnoea, n (%) | 3 (15.8) | 10 (50) | 15 (68.2)d | .003 |
| NYHA class >II, n (%) | 0 (0) | 1 (5) | 4 (18.2) | .259 |
| Systolic BP, mmHg | 130 [110–140] | 130 [120–150] | 120 [117–140] | .256 |
| Diastolic BP, mmHg | 80 [65–85] | 78 [70–80] | 80 [70–85] | .716 |
| Heart rate, bpm | 80 [70–90] | 76 [70–89] | 79 [70–87] | .936 |
| Killip class >1, n (%) | 2 (10.5) | 0 (0) | 1 (4.5) | .700 |
| Laboratory tests at hospital admission | ||||
| WBC, 109/L | 12.5 ± 3.7b,c | 7.6 ± 2.5 | 8.3 ± 4.2 | <.001 |
| Haemoglobin, g/dL | 14.3 ± 1.5 | 14 ± 1.4 | 14.5 ± 1.4 | .409 |
| Platelets, 109/L | 262 [248–301]c | 238 [195–276] | 209 [178–255] | .025 |
| CRP, mg/dL | 1.3 [.3–2.6] | .2 [.1–.5] | .5 [.2–1] | .073 |
| Glycemia, mg/dL | 133 [112–168]b,c | 98 [84–120] | 95 [79–115] | <.001 |
| HbA1c, mmol/L | 40 [38–44] | 39 [37–44] | 36 [34–39] | .077 |
| Creatinine, mg/dL | .95 ± .2 | 1.17 ± .63 | 1 ± .2 | .897 |
| eGFR, mL/min/1.73 m2 | 79 ± 15.3 | 72 ± 26 | 73 ± 19 | .701 |
| LDL, mg/dL | 125 [88–159] | 95 [55–144] | 104 [80–136] | .304 |
| Triglycerides, mg/dL | 99 [85–143] | 100 [80–181] | 90 [71–132] | .545 |
| BNP, pg/mL | 298 [179–872] | 294 [24–628] | 145 [39–1066] | .622 |
| hs-TnI peak, ng/L | 20 441 [8413–99 081] | – | – | – |
Continuous variables are presented as mean (SD) or median [interquartile range], when indicated; categorical variables as n (%). χ2 test was used for categorical variables; ANOVA for normally distributed and the Kruskal–Wallis test for non-normally distributed continuous variables.
AF, atrial fibrillation; BMI, body mass index; BNP, brain natriuretic peptide; BP, blood pressure; BSA, body surface area; CAD, coronary artery disease; CCS, chronic coronary syndrome; CKD, chronic kidney disease; COPD, chronic obstructive pulmonary disease; CRP, C-reactive protein; CVA, cerebrovascular accident; eGFR, estimated glomerular filtration rate; HbA1c, glycated haemoglobin; hs-TnI, high-sensitivity troponin I; LDL, low density lipoprotein; MI, myocardial infarction; PAD, peripheral artery disease; PCI, percutaneous coronary intervention; STEMI, ST-segment elevation myocardial infarction; WBC, white blood cells.
aPost hoc significant comparisons were carried out with the Bonferroni-corrected test.
bP significant vs CCS.
cP significant vs Controls.
dP significant vs STEMI.
ePack/years = (number of cigarettes smoked per day ÷ 20) × number of years smoked.
MNP burden
MNP detection
MNPs were detected in a significantly higher proportion of patients with STEMI (16/19, 84.2%) compared with patients with CCS (8/20, 40%) and controls (7/22, 31.8%) (P = .002) (Table 2 and Figure 2). Notably, STEMI patients exhibited a significantly higher number and diversity of MNP types [median of 3 polymers (IQR: 2–4)], compared with both CCS patients (IQR 0–2) and controls (IQR 0–2), among which no more than three different polymers were detected per patient (P < .001) (Table 2 and Supplementary data online, Table S7). In all groups, the same types of polymers were consistently detected in both peripheral and coronary blood samples within each patient, with the highest concentration being present in the coronary blood. Across all study cohorts, PE was the most frequently identified polymer, being present in 97% of the patients with detectable MNPs (see Supplementary data online, Table S7). Compared with our previously published findings,13 we additionally identified the presence of PP, PS, PET, and nylon 66 in some patients (mainly in those with STEMI), beyond PE and PVC. Conversely, ABS, SBR, PMMA, PC, and nylon 6 were not detected in any patient (see Supplementary data online, Table S7). Interestingly, the pattern of MNPs detected differed across the study cohorts. Indeed, PP was detected in only one CCS patient and in none of the controls; PS was detected only in STEMI patients; nylon was found in only one control and no CCS patient (Table 2).
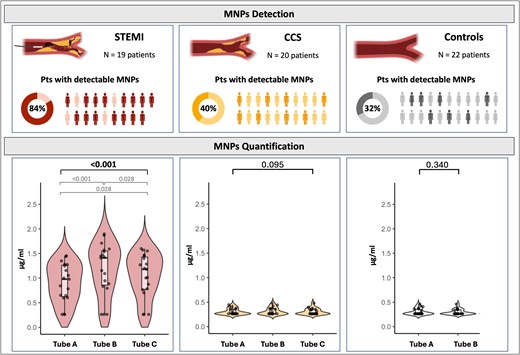
Figure 2
Detection and quantification of micro- and nanoplastics (MNPs) across study groups. At the top, the proportion of patients with detectable MNPs in each group; visual icons represent individuals with (dark colour) and without (light colour) detectable MNPs. At the bottom, quantification of MNPs (in µg/mL) in three sample types: Tube A (peripheral arterial blood), Tube B (coronary blood collected upstream to the lesion), and Tube C (coronary blood collected downstream in STEMI or post-stenting in CCS). To compare paired data, a Wilcoxon signed test, or the Friedman test were performed as appropriate. Post hoc significant comparisons were carried out with the Bonferroni-corrected test. CCS, chronic coronary syndrome; Pts, patients; STEMI, ST-segment elevation myocardial infarction
Open in new tab Table 2 Open in new tab
Overview of the type of micro- and nanoparticles detected across the study cohorts
| STEMI n = 19 | CCS n = 20 | Controls n = 22 | P-value | |
|---|---|---|---|---|
| Patients with detectable MNPs, n (%) | 16 (84.2)b,c | 8 (40) | 7 (31.8) | .002 |
| Types of MNP detected per patients | 3 [2–4] | 0 [0–2] | 0 [0–2] | <.001 |
| Polymer detected, n (%) | ||||
| PE | 15 (78.9)b,c | 8 (40) | 7 (31.8) | .007 |
| PP | 6 (31.6) | 1 (5) | 0 (0) | .004 |
| PS | 5 (26) | 0 (0) | 0 (0) | .002 |
| PVC | 9 (47.4) | 4 (20) | 3 (13.6) | .037 |
| PET | 11 (57.9)b,c | 4 (20) | 4 (18.2) | .010 |
| Nylon 66 | 5 (26.3) | 0 (0) | 1 (4.5) | .013 |
Continuous variables are presented as mean (SD) or median [interquartile range], when indicated; categorical variables as n (%). χ2 test was used for categorical variables; ANOVA for normally distributed and the Kruskal–Wallis test for non-normally distributed continuous variables.
CCS, chronic coronary syndrome; MNP, micro- and nanoplastics; PE, polyethylene; PET, polyethylene terephthalate; PP, polypropylene; PS, polystyrene; PVC, polyvinylchloride; STEMI, ST-segment elevation myocardial infarction.
aPost hoc significant comparisons were carried out with the Bonferroni-corrected test.
bP significant vs CCS.
cP significant vs Controls.
The release test showed no background contamination, indicating that the materials used to perform the invasive procedures did not release detectable MNPs into blood samples. Further supporting the absence of background contamination, in each cohort, at least one patient had no detectable MNPs in either the peripheral or coronary blood samples.
MNP concentration
The concentration of MNPs was significantly higher in STEMI patients compared with both CCS and control cohorts (P < .001) (Figure 3). These findings were consistent for both peripheral (Tube A) and coronary blood (Tube B) across the three cohorts (P < .001 for both) (Figure 3). Comparing the concentration of MNPs across the different tubes in each cohort (Tubes A, B, and C for STEMI and CCS cohorts and Tubes A and B for controls), no significant differences were observed in the CCS and control groups. Conversely, in the STEMI group, Tube B showed the highest concentration of MNPs, followed by Tube C, and Tube A (P < .001) (Figure 2).
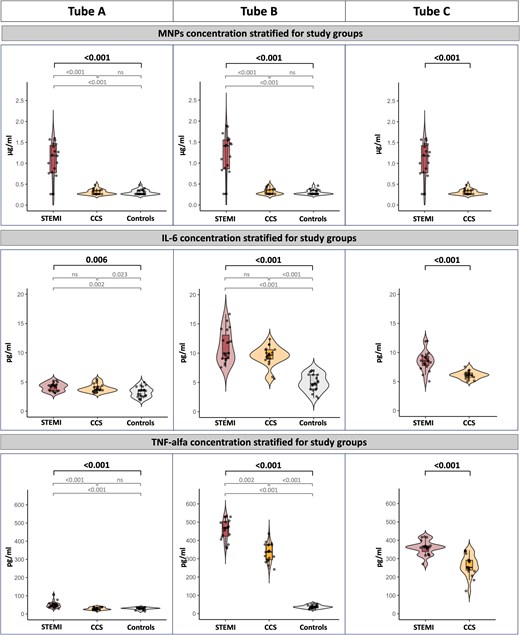
Figure 3
Concentrations of micro- and nanoplastics (MNPs), IL-6, and TNF-α across study groups and sampling sites. Differences between groups were analyzed using the Mann–Whitney U test and Kruskal–Wallis, as appropriate. Post hoc significant comparisons were carried out with the Bonferroni-corrected test. CCS, chronic coronary syndrome; IL-6, interleukin 6; STEMI, ST-segment elevation myocardial infarction; TNF, tumour necrosis factor
MNP morphology
The morphological characterization of MNPs obtained by LDIR analysis is shown in Figure 4. Among all study groups, the MNPs between 10 and 20 μm were the most prevalent, compared with those between 20–30 μm and 30–50 μm (see Supplementary data online, Figure S5). Particle morphology was classified as fragments, pellets, fibres, or spheres based on aspect ratio and circularity parameters. Pellets and fragments were the dominant morphologies in STEMI (63% and 37%, respectively) and CCS (38% and 62%, respectively) patients. Controls were mainly characterized by pellets (82%), with a minor contribution of fibres (18%) (see Supplementary data online, Figure S5).
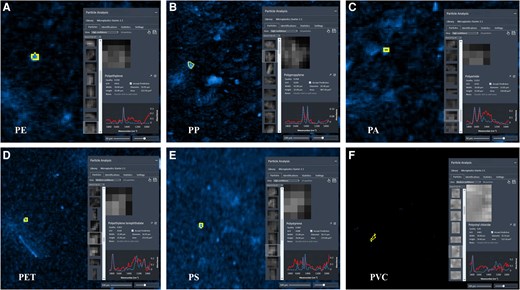
Figure 4
Case examples of MNP characterization by LDIR spectroscopy illustrating MNP shape, size distribution, and polymer composition. PA, polyamide (nylon 66); PE, polyethylene; PET, polyethylene terephthalate; PP, polypropylene; PS, polystyrene; PVC, polyvinylchloride
MNPs and inflammatory biomarkers
STEMI patients exhibited the highest concentrations of IL-6 and TNF-α compared with CCS and control patients (Figure 3). Moreover, IL-6 and TNF-α levels were significantly higher in coronary blood samples, mainly in Tube B, compared with peripheral samples in both STEMI and CCS patients, indicating a pronounced localized inflammatory response (Figure 3). Figure 5 illustrates the distribution of IL-6 and TNF-α concentration in peripheral and coronary artery blood according to the presence or absence of MNPs. In coronary artery blood, both IL-6 and TNF-α concentrations were significantly higher in patients with MNPs detection (P = .034 and P = .005, respectively).
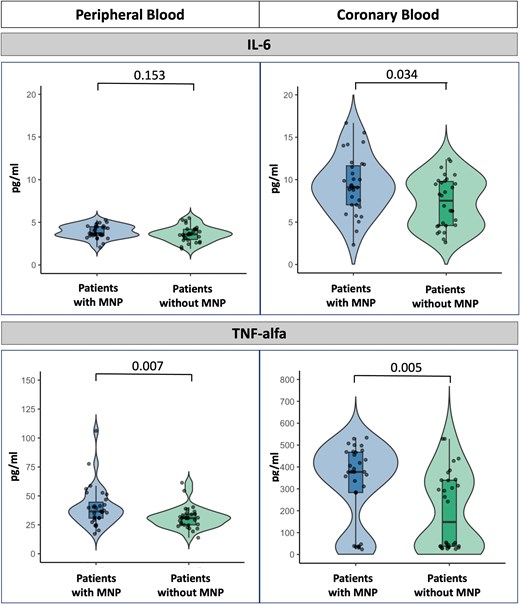
Figure 5
Distribution of IL-6 and TNF-α concentrations in peripheral and coronary artery blood according to the presence or absence of MNPs. Differences between groups were analyzed using the Mann–Whitney U test. IL, interleukin; MNP, micro and nanoplastics; TNF, tumour necrosis factor
MNPs, smoking history, and air pollution exposure
Table 3 summarizes the concentrations of the air pollutants reported on the day of the invasive procedure and the mean concentration over the previous 2 years for each study group. The distance from patients’ homes to the nearest air quality monitoring station did not significantly differ among the groups.
Table 3 Open in new tab
Air pollution exposure of patients included in the study population, stratified by clinical presentation
| STEMI n = 19 | CCS n = 20 | Controls n = 22 | P-valuec | |
|---|---|---|---|---|
| Day of the invasive procedure | ||||
| PM2.5, μg/m3 | 20 [13–38]d,e | 12 [7–21] | 11 [9–20] | .012 |
| PM2.5 > 15 μg/m3, n (%)a | 13 (68.4) | 7 (35) | 8 (36.4) | .059 |
| PM10, μg/m3 | 36 [18–53] | 23 [16–41] | 30 [16–40] | .614 |
| O3, μg/m3 | 22 [16–84] | 32 [13–49] | 32 [21–61] | .449 |
| NO2, μg/m3 | 49 [26–59] | 34 [21–43] | 35 [21–48] | .080 |
| C6H6, μg/m3 | .5 [.4–.6] | 1.3 [.8–1.5] | .7 [.5–.8] | .174 |
| SO2, μg/m3 | 3 [2–4] | 4.5 [2.3–4.7] | 3 [2–6] | .537 |
| CO, mg/m3 | .8 [.5–.9] | .8 [.7–1.1] | .8 [.7–1.0] | .594 |
| Average of the last 2 years | ||||
| PM2.5, μg/m3 | 17 [11–22]a | 13 [11–15] | 9 [7–14] | .010 |
| PM2.5 > 5 μg/m3, n (%)a | 19 (100) | 19 (95) | 19 (86.4) | .508 |
| PM2.5 > 15 μg/m3, n (%)b | 9 (47.4)e | 3 (15) | 1 (4.5) | .003 |
| PM10, μg/m3 | 23 [19–31] | 28 [23–29] | 23 [20–31] | .443 |
| O3, μg/m3 | 81 [62–83]d | 42 [34–47] | 49 [41–68] | .043 |
| NO2, μg/m3 | 19 [9–30] | 30 [21–35]f,e | 19 [13–30] | .003 |
| C6H6, μg/m3 | .5 [.4–.7] | .8 [.7–1]f | .7 [.5–.8] | .007 |
| SO2, μg/m3 | 2.7 [1.9–4] | 2 [1.4–3.7] | 2.2 [1.8–4] | .504 |
| CO, mg/m3 | .9 [.8–1] | .9 [.8–1.1] | .9 [.8–1] | .547 |
| Air quality monitoring station | ||||
| Distance from home, km | 6.4 [2.3–14] | 4.5 [2.5–9] | 7 [2–15] | .620 |
Continuous variables are presented as mean ± standard deviation or as median [interquartile range].
C6H6, benzene; CCS, chronic coronary syndrome; CO, carbon monoxide; NO2, nitric dioxide; O3, ozone; PM, particulate matter; SO2, sulfur dioxide; STEMI, ST-segment elevation myocardial infarction.
aPM2.5 values above the recommended levels for optimal health protection according to WHO global air quality guidelines 2021.21
bPM2.5 values above the recommended levels of interim target 3 (IT-3) according to WHO global air quality guidelines 2021.21
cPost hoc significant comparisons were carried out with the Bonferroni-corrected test.
dP significant vs CCS.
eP significant vs Controls.
fP significant vs STEMI.
On the day of the invasive procedure, PM2.5 levels were significantly higher in the STEMI group (P = .012). No significant differences were observed among groups for PM10, O3, NO2, C6H6, SO2, or CO on the day of the invasive procedure. Considering the 2-year average exposure, STEMI patients were exposed to higher levels of PM2.5 (P = .010) and O3 (P = .043) compared with the other groups. Conversely, NO2 and C6H6 levels were significantly lower in STEMI patients compared with CCS group (P = .003 and P = .007, respectively). No significant differences were observed for PM10, SO2, or CO. Remarkably, over 93% of the study population had been chronically exposed to PM2.5 levels exceeding 5 µg/m3. A significantly higher proportion of patients presenting with STEMI were exposed to chronic PM2.5 concentrations above the WHO Interim Target 3 threshold (>15 µg/m3), compared with the other study groups (P = .003) (Table 3).
The presence of MNPs was significantly more frequent in patients chronically exposed to PM2.5 levels >15 µg/m3 (compared with those exposed to lower levels, P = .006, Figure 6B) and among smokers (P = .017, Figure 6A; P = .006, Supplementary data online, Figure S6). Notably, MNPs were detected in all STEMI patients with a history of smoking, whereas none of the non-smoking controls exhibited detectable MNPs. When stratifying according to both smoking status and chronic PM2.5 exposure, all patients with both risk factors (i.e. smokers and PM2.5 > 15 µg/m3) had detectable MNPs (P < .001, Figure 6C and D). Moreover, stratifying the presence of MNPs according to CAD prevalence revealed distinct patterns between smokers and non-smokers. Among smokers, the prevalence of detectable MNPs was comparable between patients with and without CAD (64.3% vs 63.6%; Supplementary data online, Figure S7). Conversely, among non-smokers, detectable MNPs were present in 54.5% of patients with CAD but were absent in those without CAD, indicating a significant difference between groups (P = .004; Supplementary data online, Figure S7).
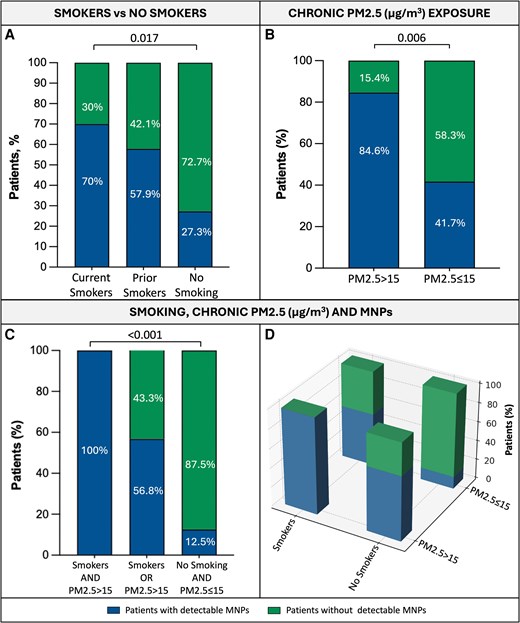
Figure 6
Smoking status, chronic PM2.5 exposure, and detection of MNPs in the overall study population. Differences between groups were analyzed using the chi-square test or Fisher’s exact test, as appropriate. MNP, micro- and nanoplastics; PM, particulate matter
In univariate analysis assessing predictors of MNP presence in the overall study population, a history of smoking (OR 4.76, 95% CI 1.52–14.9, P = .007), obstructive CAD (OR 3.43, 95% CI 1.13–9.35, P = .029), coronary IL-6 (OR 1.23, 95% CI 1.03–1.46, P = .021) and TNF-α (OR 1.01, 95% CI 1.00–1.03, P = .007) and daily PM2.5 exposure on the day of the invasive procedure (OR 1.16, 95% CI 1.01–1.36, P = .034), and average PM2.5 exposure over the previous 2 years (OR 1.08, 95% CI 1.02–1.18, P = .023) were all significantly associated with MNP detection (Table 4). In multivariate analysis, smoking history emerged as the only independent predictor of MNP detection (OR 5.69, 95% CI 1.33–26.63, P = .023) (Table 4). Additional regression models were conducted to test the influence of sampling methodology, study group, inflammatory biomarkers (from both peripheral and coronary blood), air pollution exposure, and the smoking × PM2.5 interaction term. Remarkably, smoking history was confirmed to be the only independent predictor of MNP presence and remained consistent after adjustment (see Supplementary data online, Tables S8–S12). Lastly, MNP detection emerged as an independent predictor of obstructive CAD (OR 4.48, 95% CI 1.17–17.19, P = .029, Supplementary data online, Table S13; OR 4.47, 95% CI 1.03–19.30; P = .045, Supplementary data online, Table S14) together with male sex and dyslipidemia, while smoking history was not (see Supplementary data online, Tables S13 and S14).
Table 4 Open in new tab
Univariate and multivariate analysis testing predictors of micro- and nanoparticle detection in the study population
| Variables | Univariate analysis | Multivariate analysis | ||||
|---|---|---|---|---|---|---|
| OR | 95% CI | P-value | OR | 95% CI | P-value | |
| Age, years | .98 | .95–1.03 | .615 | – | – | – |
| Male sex | .42 | .15–1.32 | .137 | – | – | – |
| Hypertension | .61 | .22–1.71 | .346 | – | – | – |
| Dyslipidemia | .59 | .23–1.71 | .334 | – | – | – |
| T2DM | .79 | .23–2.69 | .705 | – | – | – |
| Smoking history | 4.76 | 1.52–14.9 | .007 | 5.69 | 1.33–26.63 | .023 |
| CKD | .35 | .13–1.94 | .226 | – | – | – |
| HbA1c, mmol/mol | 1.02 | .96–1.07 | .705 | – | – | – |
| LVEF, % | .98 | .96–1.04 | .944 | – | – | – |
| Obs-CAD | 3.43 | 1.13–9.35 | .029 | .38 | .13–10.29 | .395 |
| IL-6, pg/mLa | 1.23 | 1.03–1.46 | .021 | .96 | .65–1.41 | .841 |
| TNF-α, pg/mLa | 1.01 | 1.00–1.03 | .007 | 1.01 | .99–1.02 | .092 |
| PM2.5 (day), µg/m3 | 1.16 | 1.01–1.36 | .034 | 1.10 | .87–1.37 | .454 |
| PM10 (day), µg/m3 | 1.02 | .98–1.05 | .361 | – | – | – |
| PM2.5 (year), µg/m3 | 1.08 | 1.02–1.18 | .023 | 1.11 | .89–1.38 | .327 |
| PM10 (year), µg/m3 | .96 | .87–1.05 | .335 | – | – | – |
CI, confidence interval; CKD, chronic kidney disease; HbA1c, glycated haemoglobin; IL, interleukin; LVEF, left ventricular ejection fraction; Obs-CAD, obstructive coronary artery disease (including ST-segment elevation myocardial infarction and chronic coronary syndrome patients); OR, odds ratio; PM, particulate matter; T2DM, type 2 diabetes mellitus; TNF, tumour necrosis factor.
aIL-6 and TNF-α in coronary samples.
Discussion
In this study, we investigated the burden (presence, concentration, and type) of MNPs in the coronary blood of patients undergoing invasive coronary angiography for suspected CAD, both in the acute and chronic setting, also exploring the association of MNPs with air pollution and inflammatory biomarkers. The main findings were: (i) MNPs were detected significantly more often in STEMI patients compared with CCS patients and controls (P = .002); (ii) STEMI patients showed a higher number and greater diversity of MNPs (median of 3 polymer types), with PE being the most commonly detected polymer (present in 97% of patients with detectable MNPs); (iii) the same types of polymers were consistently detected in both peripheral and coronary blood samples within each patient, with the highest concentration being present in the coronary blood (Tube B); (iv) STEMI patients exhibited higher concentrations of IL-6 and TNF-α compared with CCS and control patients, particularly in coronary blood samples; (v) STEMI patients were exposed to higher levels of PM2.5 both on the day of the invasive procedure (P = .012) and over the preceding 2 years (P = .010), compared with the other cohorts; (vi) MNP detection was more frequent among smokers and patients exposed to PM2.5 > 15 µg/m3 (P = .006), with all patients presenting both factors showing detectable MNPs (P < .001); and (vii) in multivariable analysis, smoking history was the only independent predictor of the presence of MNPs (Structured Graphical Abstract).
MNPs, inflammatory burden, and atherosclerotic disease
Emerging evidence indicates that MNPs, once considered inert contaminants, are biologically active pollutants contributing to the pathophysiology of cardiovascular diseases, particularly by promoting the development and progression of atherosclerotic plaques and potentially triggering adverse cardiovascular events.10,16 However, current knowledge is predominantly based on in vitro experiments and preliminary ex vivo findings, highlighting the need for in vivo and clinical investigations.7,10,22–24 Preclinical studies support a potential link between MNPs and atherosclerotic processes.25 In ApoE-deficient mice fed a high-fat diet, oral exposure to PS nanoplastics was associated with increased arterial stiffness and atherosclerotic plaque burden, alongside macrophage activation and altered lipid metabolism.26 Complementary in vitro studies have shown that nanoplastics can promote foam cell formation and smooth muscle cell migration.27 The present study provides in vivo evidence of MNPs in arterial coronary blood samples across the whole spectrum of CAD. Importantly, the sampling protocol utilized materials routinely available in the catheterization laboratory, and contamination controls were performed to validate sample integrity. These findings demonstrate that the in vivo detection and quantification of MNPs in arterial coronary blood is feasible, using a reliable sampling methodology.
To explore the potential association of MNPs with CAD, we adopted the following methodological measures: (i) sampling of arterial coronary blood, together with arterial peripheral blood; (ii) inclusion of patients presenting the whole spectrum of CAD, from the acute setting (STEMI cohort) to the chronic one (CCS cohort); (iii) comparison of the findings with a control group of patients with angiographically normal coronary arteries. This approach enabled a comprehensive assessment of the coronary milieu across the full spectrum of CAD, beyond the systemic arterial circulation, acknowledging the critical role of localized pro-atherosclerotic and pro-inflammatory processes in the pathophysiology of CAD. Patients with STEMI showed the highest prevalence of MNPs (84%), particularly in coronary blood proximal to the occlusion site—approximately double the rate in CCS patients and nearly triple that in controls—suggesting a potential link between MNPs and acute atherothrombotic events. The observation that IL-6 and TNF-α concentrations were highest in STEMI patients, particularly within the coronary circulation, and were more elevated in the presence of detectable MNPs supports an exploratory association between MNP burden and a localized pro-inflammatory milieu in patients with obstructive CAD. These mechanisms might collectively contribute to endothelial dysfunction, vascular remodelling, and plaque instability, all hallmarks of progressive atherosclerosis.6,10
The present study adds value to the existing literature by not only detecting MNPs but also characterizing their morphological features using LDIR analysis. This approach enabled us to introduce the concept of ‘pattern of MNPs’, which appears to vary in type, size, and shape according to the clinical presentation of CAD, suggesting that this might contribute to the pathogenesis and destabilization of atherosclerotic plaques. These findings pave the way for further investigation into whether the qualitative profile, shape, or overall burden of MNPs impacts CAD progression.28
MNPs and air pollution exposure
Air pollution and smoking are widely recognized as major exposome risk factors.2,3,29 Numerous epidemiological and experimental studies have established a strong association between exposure to PM2.5 and the development and progression of CAD, including the onset of acute coronary events.19,30,31 Chronic exposure to PM2.5 has been linked to accelerated atherosclerotic plaque formation, while short-term spikes in ambient PM2.5 levels may act as triggers for plaque destabilization, leading to myocardial infarction or other acute atherothrombotic events.32,33 Our findings not only support the established association between PM2.5 exposure and acute cardiovascular events but also, for the first time, link these environmental pollutants, particularly PM2.5, and smoking, with the presence of MNPs across the spectrum of CAD. Given their shared primary route of exposure, predominantly through inhalation, growing evidence suggests that PM2.5 may serve as vectors for MNPs, facilitating their transport and deposition within the respiratory tract, where both pollutants may synergistically and cumulatively contribute to epithelial barrier disruption and systemic translocation.34–36
Similarly, cigarette smoking is a well-known disruptor of epithelial barrier integrity, particularly in the respiratory tract. In our study, smoking emerged as the only independent predictor of MNPs detection, with smokers exhibiting significantly higher concentrations of MNPs compared with non-smokers. Interestingly, MNPs were detected in all STEMI patients with a history of smoking, whereas none of the non-smoking controls exhibited detectable MNPs. Overall, these findings suggest that smoking might facilitate the inhalation and deposition of MNPs in the lower respiratory tract, likely through mechanisms involving epithelial barrier disruption and oxidative stress.37 The deposition of MNPs in the respiratory tract depends on their size, with larger particles settling in the upper airways and smaller ones reaching deeper segments of the lungs, increasing the likelihood of their translocation into the systemic circulation.38,39 This supports our observation that small-sized MNPs were most frequently detected in both coronary and peripheral blood samples. Previous studies have reported the presence of MNPs in up to 99% of cigarette filters.40 However, the polymers constituting cigarette filters (primarily cellulose acetate) differ from those identified in coronary samples, which mainly comprised PE. This suggests that not all MNPs detected in smokers originate from cigarette filters. Indeed, smoking may increase exposure to environmental MNPs through repetitive hand-to-mouth movements, frequent inhalation, and smoking-induced impairment of epithelial integrity, ciliary function, and mucus clearance.37 Consistent with our findings, recent studies have shown that both indoor and outdoor air commonly contain similar polymers—primarily PET, PE, PP, PS, and PVC—with reported concentrations ranging from <1 to over 1000 MPs m−3.41,42 Thus, cigarette smoke is emerging not only as a source of chemical toxins but also as a vector for MNP inhalation, contributing to systemic absorption and, by extension, exacerbating cardiovascular risk in exposed individuals.34,35,37
Clinical implications
The present study addresses an urgent and emerging public health issue by investigating the association between MNPs, PM2.5, and smoking in CAD, both in the acute and chronic settings, potentially amplifying their damaging effects on cardiovascular health. MNPs, PM2.5, and smoking constitute potentially modifiable environmental risk factors for cardiovascular diseases, with significant implications for public health and cardiovascular disease prevention.
Indeed, the association among MNPs, smoking, and air pollution underscores the urgent need to shift from isolated risk factor management toward comprehensive environmental health strategies, moving from ‘patient-level’ to ‘population-level’ preventive measures. Recognizing the cardiovascular system’s sensitivity to ambient and behavioural pollutants demands integration of air quality monitoring, anti-smoking interventions, plastic pollution reduction, and exposomic assessment into cardiovascular disease prevention guidelines.43 The greater exposure to PM2.5 levels above the WHO Interim Target 3 in STEMI patients may suggest a meaningful cardiovascular risk even at concentrations deemed acceptable in highly industrialized settings, thereby calling into question both the practicality of achieving—and the adequacy of—the current WHO chronic-exposure targets. Future research should aim to quantify individual MNP exposure, assess combined pollutant burden, and validate interventions that target this expanded network of environmental cardiovascular hazards.